Description
About the Author
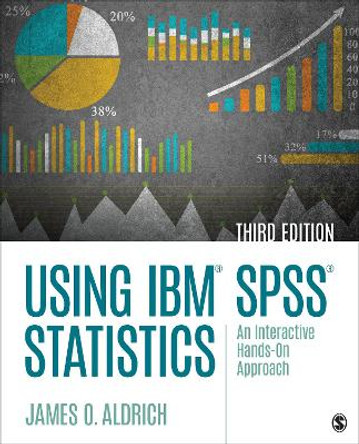
James O. Aldrich (Doctor of Public Administration, University of Laverne) is a retired lecturer on statistics and research methods at California State University, Northridge. He has also taught graduate level research courses for the University of La Verne. Dr. Aldrich held the appointment of Instructor in the Department of Pathology at the University of Southern California, School of Medicine where he served as the Principal Investigator and codirector of a National Cancer Institute research project. He has served on various committees for the Los Angeles chapter of the American Statistical Association and has also taught biostatistics, epidemiology, social statistics, and research methods courses for 20 years. The primary computer program used for his coursework has been the IBM SPSS Statistics software package. SAGE recently published, in 2013, Building SPSS Graphs to Understand Data, coauthored with Hilda M. Rodriguez. Hilda M. Rodriguez (Bachelor's Degree in Sociology, California State University at Northridge) was the teaching assistant in statistics and the laboratory using the Statistical Package for the Social Sciences. She edited the original manuscript and discovered many useful additions that were incorporated in Using SPSS: An Interactive and Hands-on Approach, a book published by Sage Publications in July 2011. She came to this country from El Salvador speaking Spanish only but soon learned English and has begun her pursuit of higher education. Hilda is active at her church, St. Joseph the Worker, in Winnetka, California where she teaches religious doctrine to children, young adults and seniors. It is in this work that her bi-lingual and bi-cultural capabilities benefit her students.
Reviews
"This book provides excellent descriptions and guidance on the use of graphical images for data presentation. These are necessary tools for all students pursuing graduate degrees with a research component attached." -- Clifton C. Addison
"I am delighted to see a book of this kind. It fills a gap in conventional statistics books, which devote just one chapter to graphical displays. This book helps students make the connection between research questions and graphical approaches in a way that no other statistics book has done." -- Camille L. Lawrence
"I like the approach that argues graphs are one way to understand data and answer pertinent questions. This is a very useful entree for the many 'number-phobic' students we encounter in social work." -- Rosemary McCaslin
"I don't know of a comparable book. There are many excellent books on SPSS statistical procedures but this is the first one on graphics that I've seen which is why I was so excited to review it...The level of detail and the number of examples are key strengths. My impression that overall it is one of a kind is the biggest strength."
-- James P. Donnelly
"It's easy to read, and provides plenty of examples and practice so students can get the concepts." -- David Nalbone
"It presents a comprehensive list of graphs available in SPSS, with details about how to construct and interpret them." -- Thomas Short
"The comprehensive treatment of an important topic, including 'walk-throughs' of how to produce a graph of each type, is well done. The chapter on deception brings in coverage of a useful and important topic as well." -- Christopher Lawrence
Book Information
ISBN 9781452216843
Author James O. Aldrich
Format Paperback
Page Count 392
Imprint SAGE Publications Inc
Publisher SAGE Publications Inc
Weight(grams) 650g


